The ‘hockey stick’ climate graph, depicting an unprecedented rise in temperatures in the 20th century, is reliable
In all subsequent reconstructions it is concluded that for 150 years temperatures have not stopped increasing
A podcast with more the 990 plays on iVoox claims that “the hockey stick graph” – known for documenting an unprecedented rise in temperatures in the Northern Hemisphere in the 20th century and for being one of the most frequently used figures to illustrate climate change – is “a hoax” since it “hides the medieval warm period and the Little Ice Age”, two periods of anomalous temperatures in the history of humanity.
This claim is MISLEADING. It is true that the first publication of the hockey stick graph in 1999 did not include the medieval warm period – which took place between 950 and 1250 – since the time scale only began in 1400. However, starting in 1999, the same authors incorporated the entire past millennium, including this period, into their graph. As far as the Little Ice Age goes, it actually was included in the first graph, the authors explain in this study.
“The hockey stick hoax by Michael Mann […] What it shows is some generally stable temperatures until the middle of the century […] and bam! Then they shoot up. […] What is it that’s going on there? That […] this graph hides the medieval warm period and the Little Ice Age”
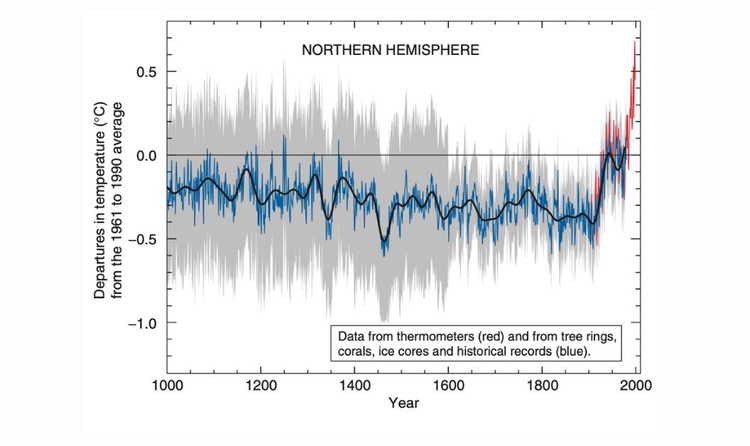
The hockey stick graph was the work of environmental scientist and geophysicist Michael E. Mann of the University of Pennsylvania. It showed very clearly how the temperatures in the Northern Hemisphere underwent a “dramatic shift” upwards from the Industrial Revolution onwards, forming a shape akin to the blade of a hockey stick, as Mann himself explains in The Climate Book by Greta Thunberg (Penguin Press, 2022). The data used in the graph were not taken from thermometers, which were invented by Gabriel Fahrenheit in the early 18th century, but from proxies, such as tree rings, corals ice cores and lake sediments.
Given the relevance the graph attained at the time – it is, along with the climate stripes, one of the most famous visualisations in the history of climate change – voices emerged that spoke out against it, trying to delegitimize it in various ways. And this questioning, although lacking any scientific basis, continues to this day.
A graph that gets updated regularly
It is not true, however, that graph is a “hoax”, as the protagonists of the podcast claim. It is true that the hockey stick graph, in its first version published in Nature magazine in 1998, started in the year 1400 and, therefore, did not take into account the medieval warm period – a period of abnormally high temperatures that occurred in the Northern Hemisphere between the years 950 and 1250. However, the authors did take into account the variation in values of the Little Ice Age, which occurred between the 14th and the 19th centuries.
Still, Mann and his team updated the graph on two occasions: first, one year later, in 1999, and then in 2003. In these two updates they used broader time scales in which they included the medieval warm period. And in all the versions of the graph, the shape is the same: in general we see insignificant variations in temperatures until the start of the Industrial Revolution. What’s more, in the 2003 version, there is not only an analysis of the Northern Hemisphere, but also of the Southern Hemisphere and of the entire world.
In the nearly 25 years since the graph’s initial publication, other reconstructions have been made, such as this one, in 2007, or this one, in 2006. All of them show a sudden increase in temperatures starting in the 20th century, just like the original hockey stick graph.
The final of these reconstructions appears in the summary for policymakers published in 2021 by the IPCC, or the Intergovernmental Panel on Climate Change, the leading scientific body in the assessment of climate change. In fact, the graph has been so relevant to the scientific community that the IPCC has been including it in their reports since 2001, thus making it a part of the body of scientific evidence demonstrating the existence of global warming caused by greenhouse gases emitted as a result of human activities.